
One of the challenges to understanding the spread of COVID19 data is the availability of data. Each day, members of the Data User Group have been updating a CSV file on our Github and a shared Google Sheet with information from the Ontario Ministry of Health’s COVID 19 daily updates. As the capacity for testing has expanded and the number of identified cases has increased, the once detailed tables of data available on the Ministry website has become daily notices: “Information for all cases today are pending.”
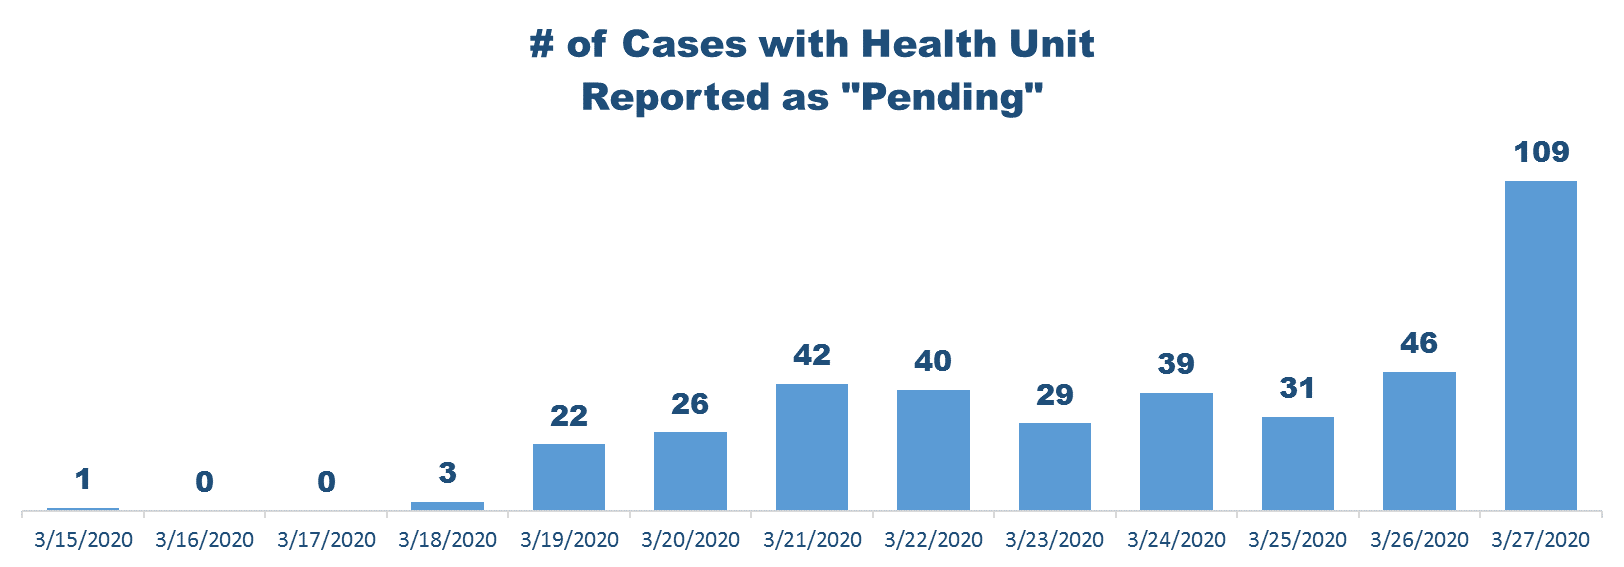
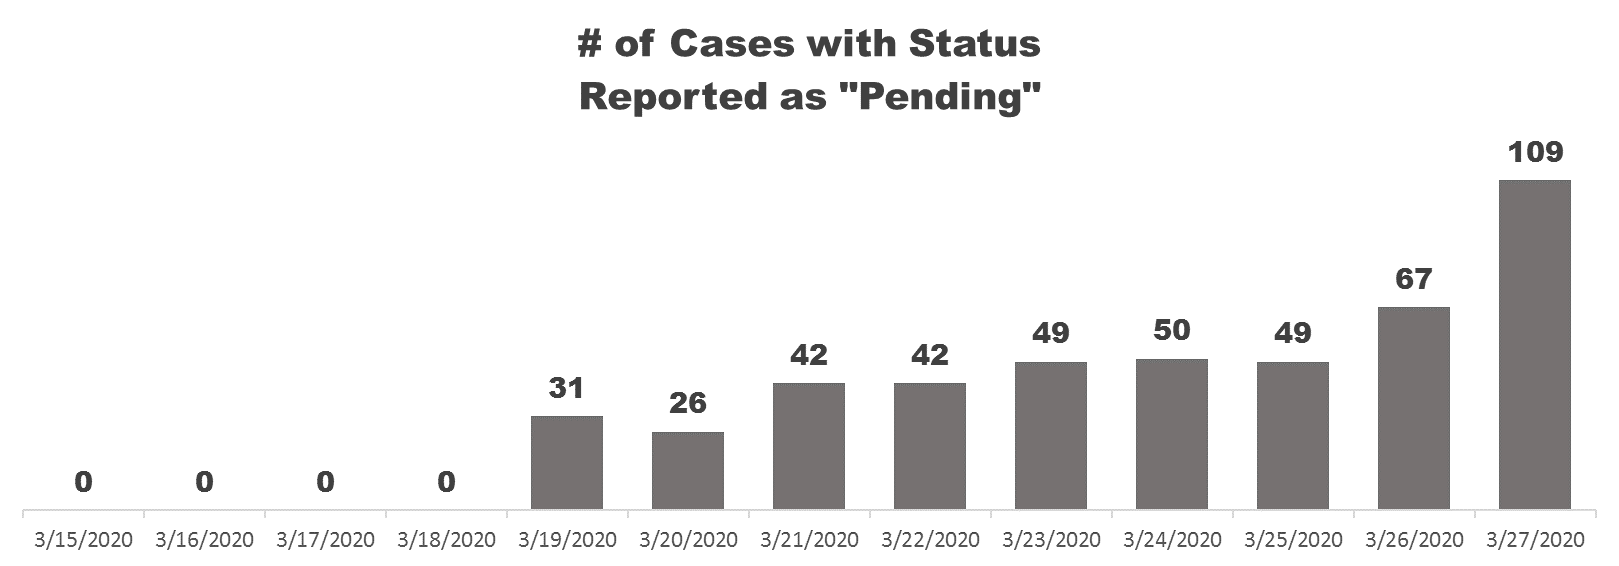
Unfortunately, since the Ministry of Health does not provide updates on the reported cases, every record coded as “pending” effectively becomes missing data. Fortunately, each of the regional Health Units are providing updates on the numbers of cases on their websites. These regional updates have been useful to validate and cross-reference the tables that Wikipedia has been maintaining (mentioned in the previous post). This compiled data set is available in the shared Googles Sheet under the tab “Wikipedia”.
Following are a few of the questions we have explored with the data we have compiled (click on the visual to see it in a larger format):
What are the origins of internationally acquired COVID19 cases in Ontario?
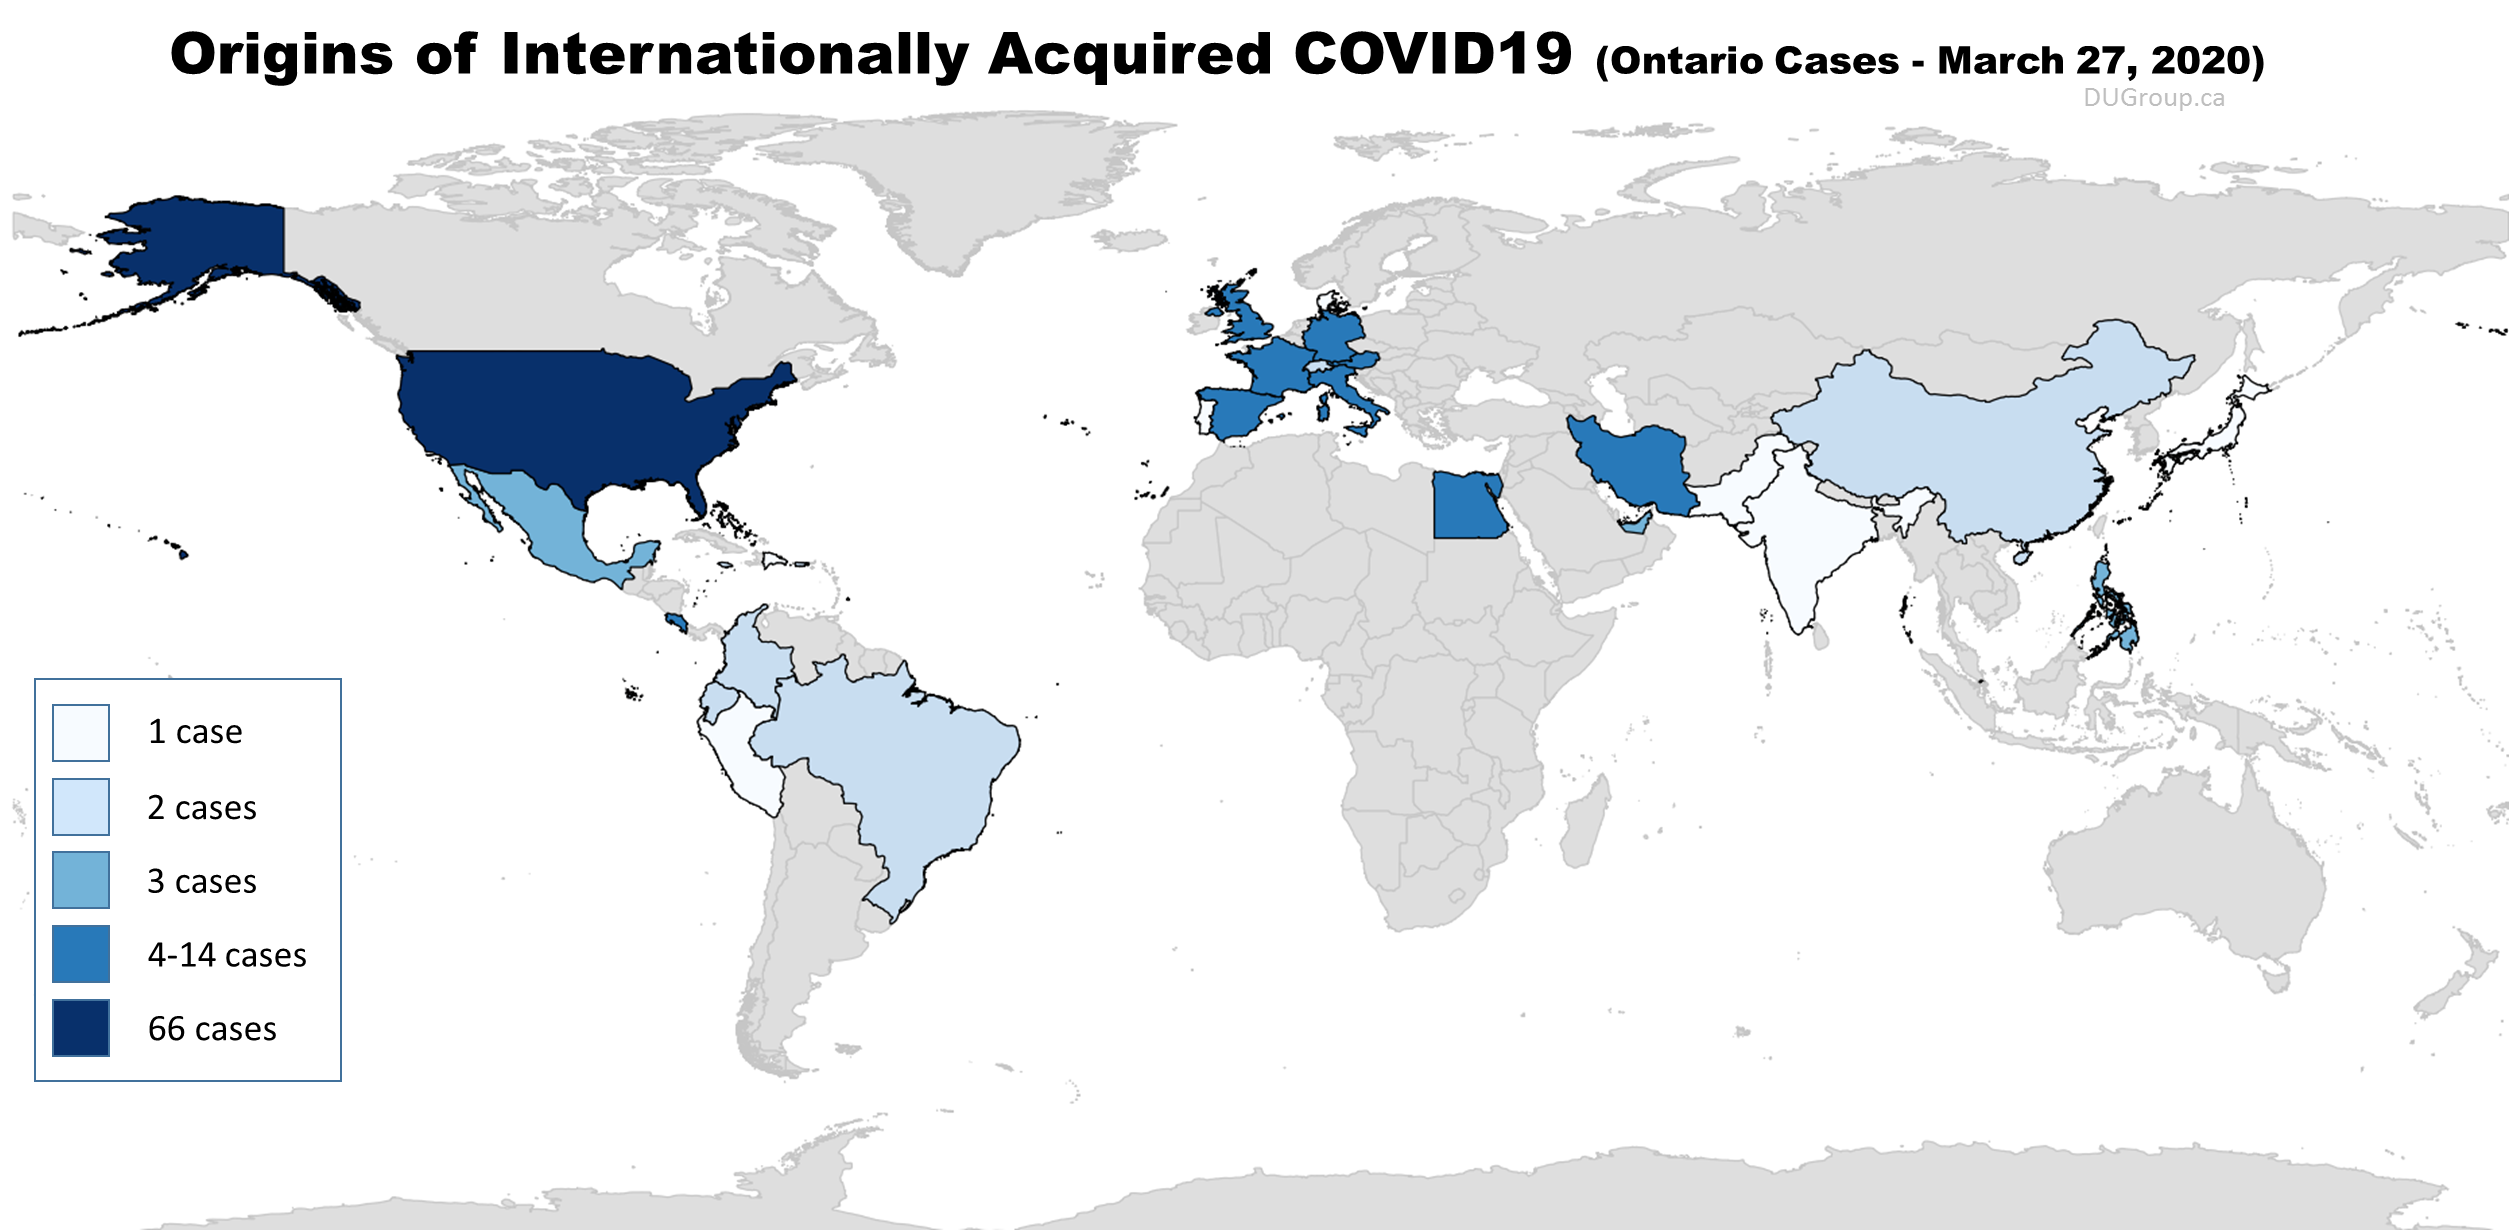 Data source: “Wikipedia” tab in the DUG Google Sheet
Tool: QGIS
Where are the confirmed COVID19 cases in Ontario?
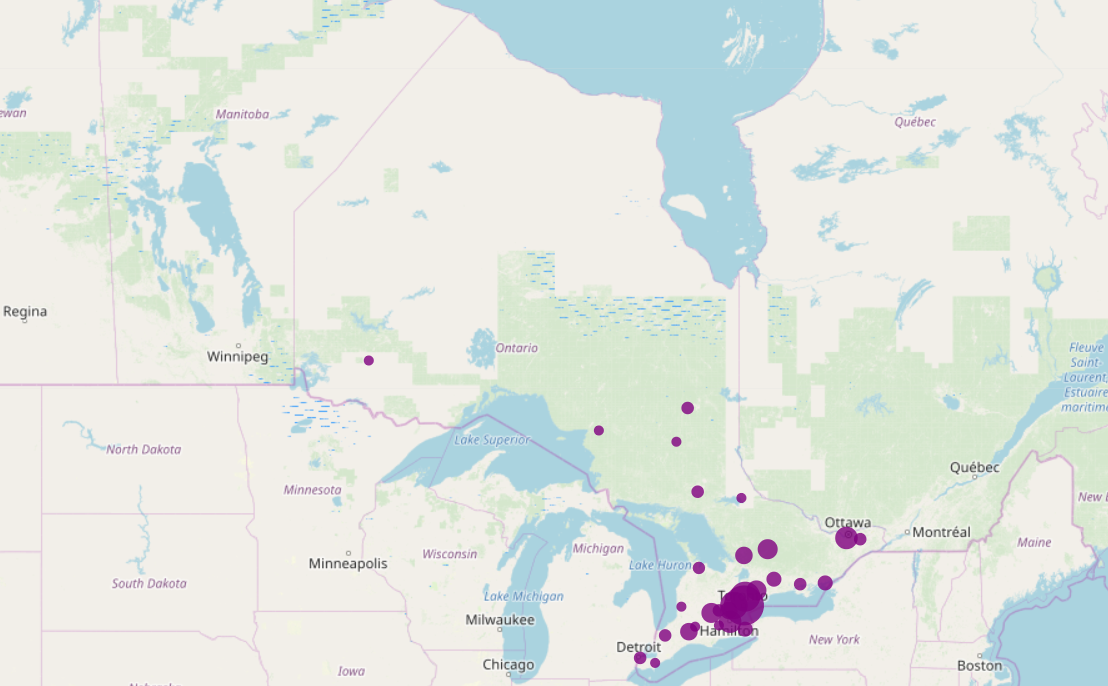
Data source: Github csv
Tool: R – Shiny Dashboard, Interactive Map (Greg Rousell)
What does the growth of COVID19 confirmed cases look like in each region?
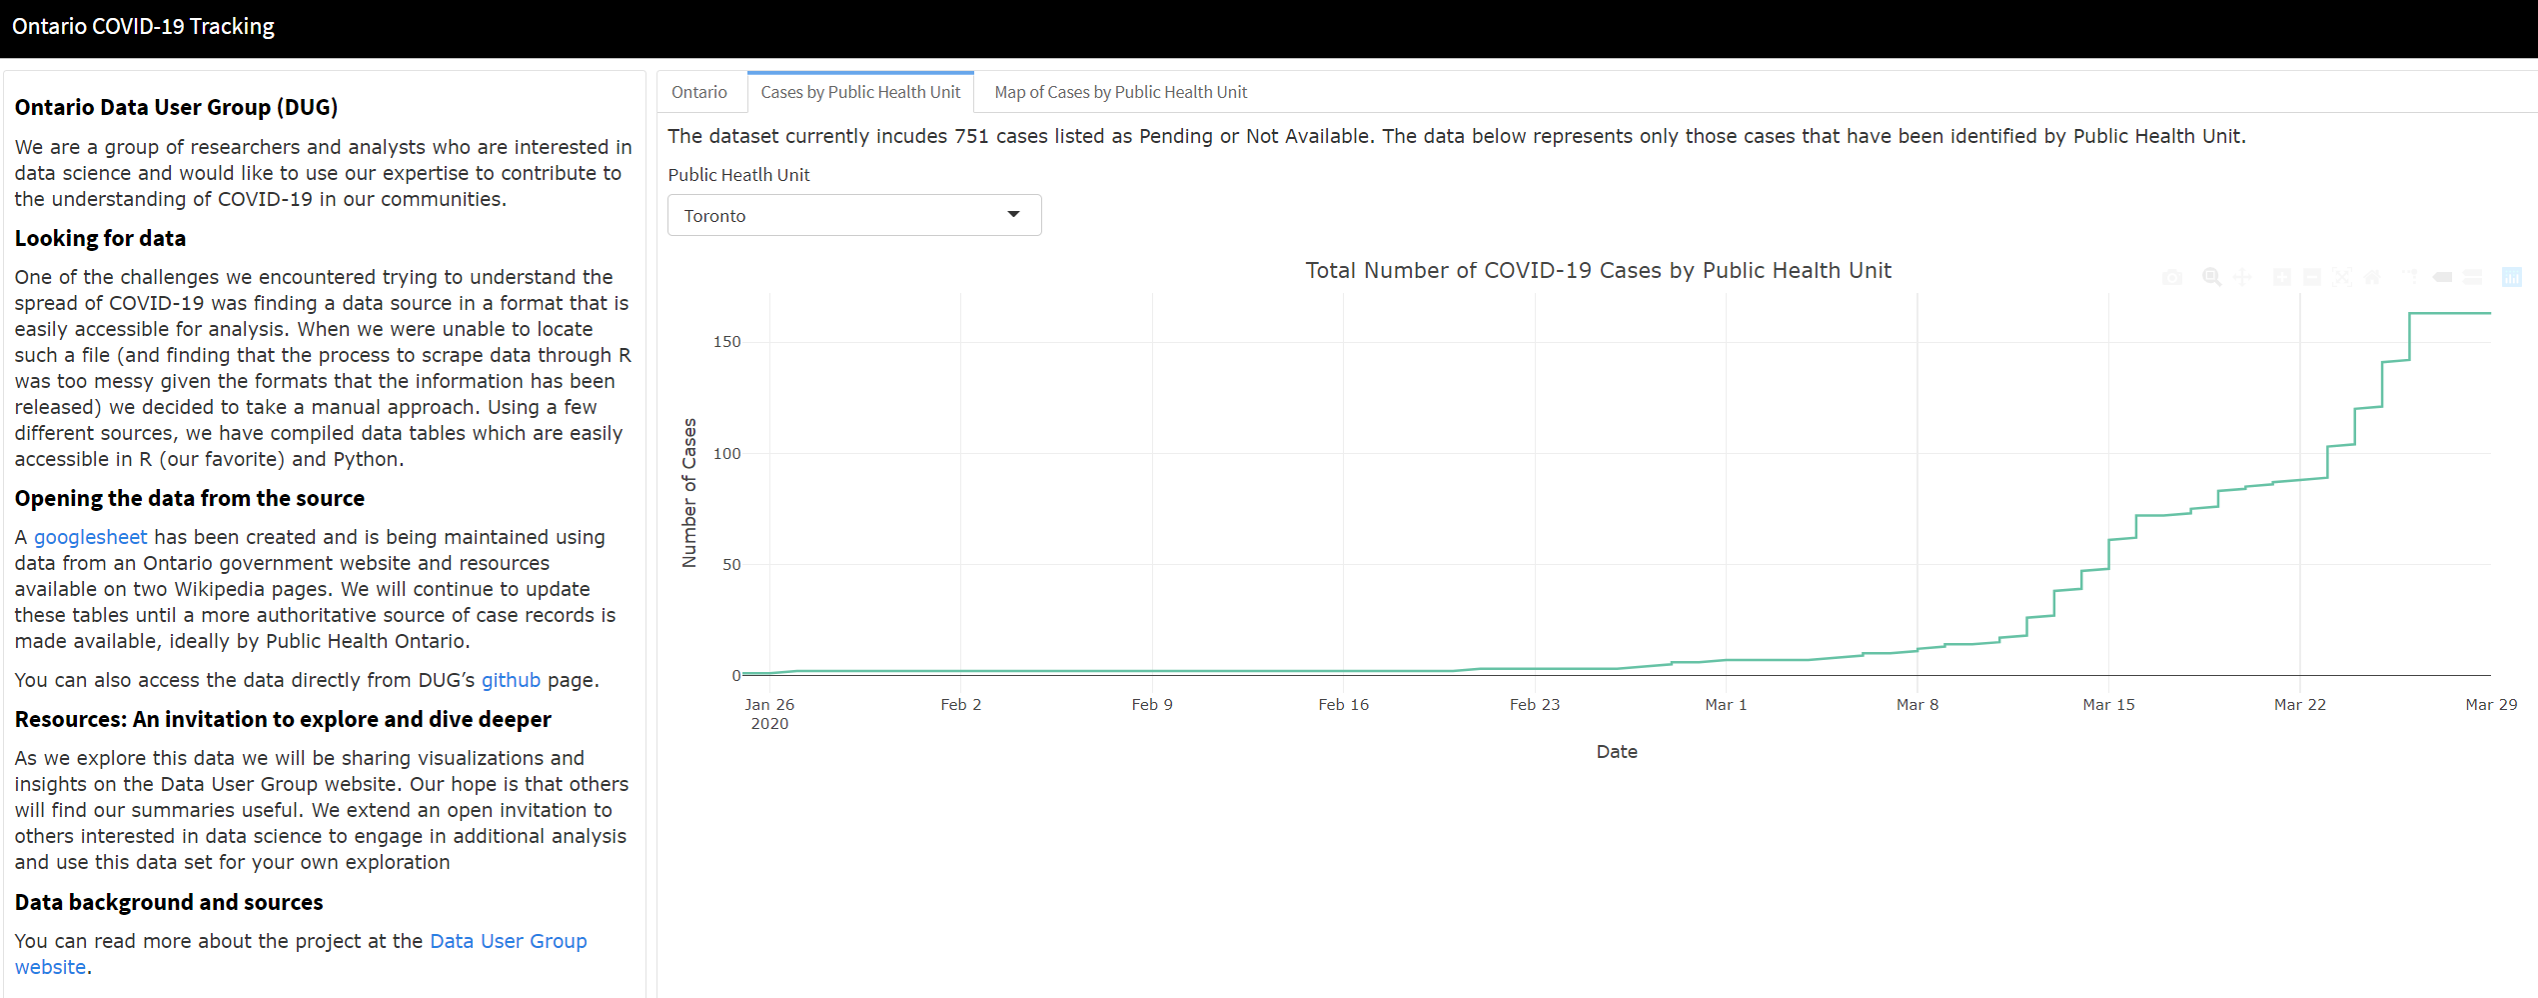
Data source: Github csv
Tool: R – Shiny Dashboard, Interactive Plots (Greg Rousell)
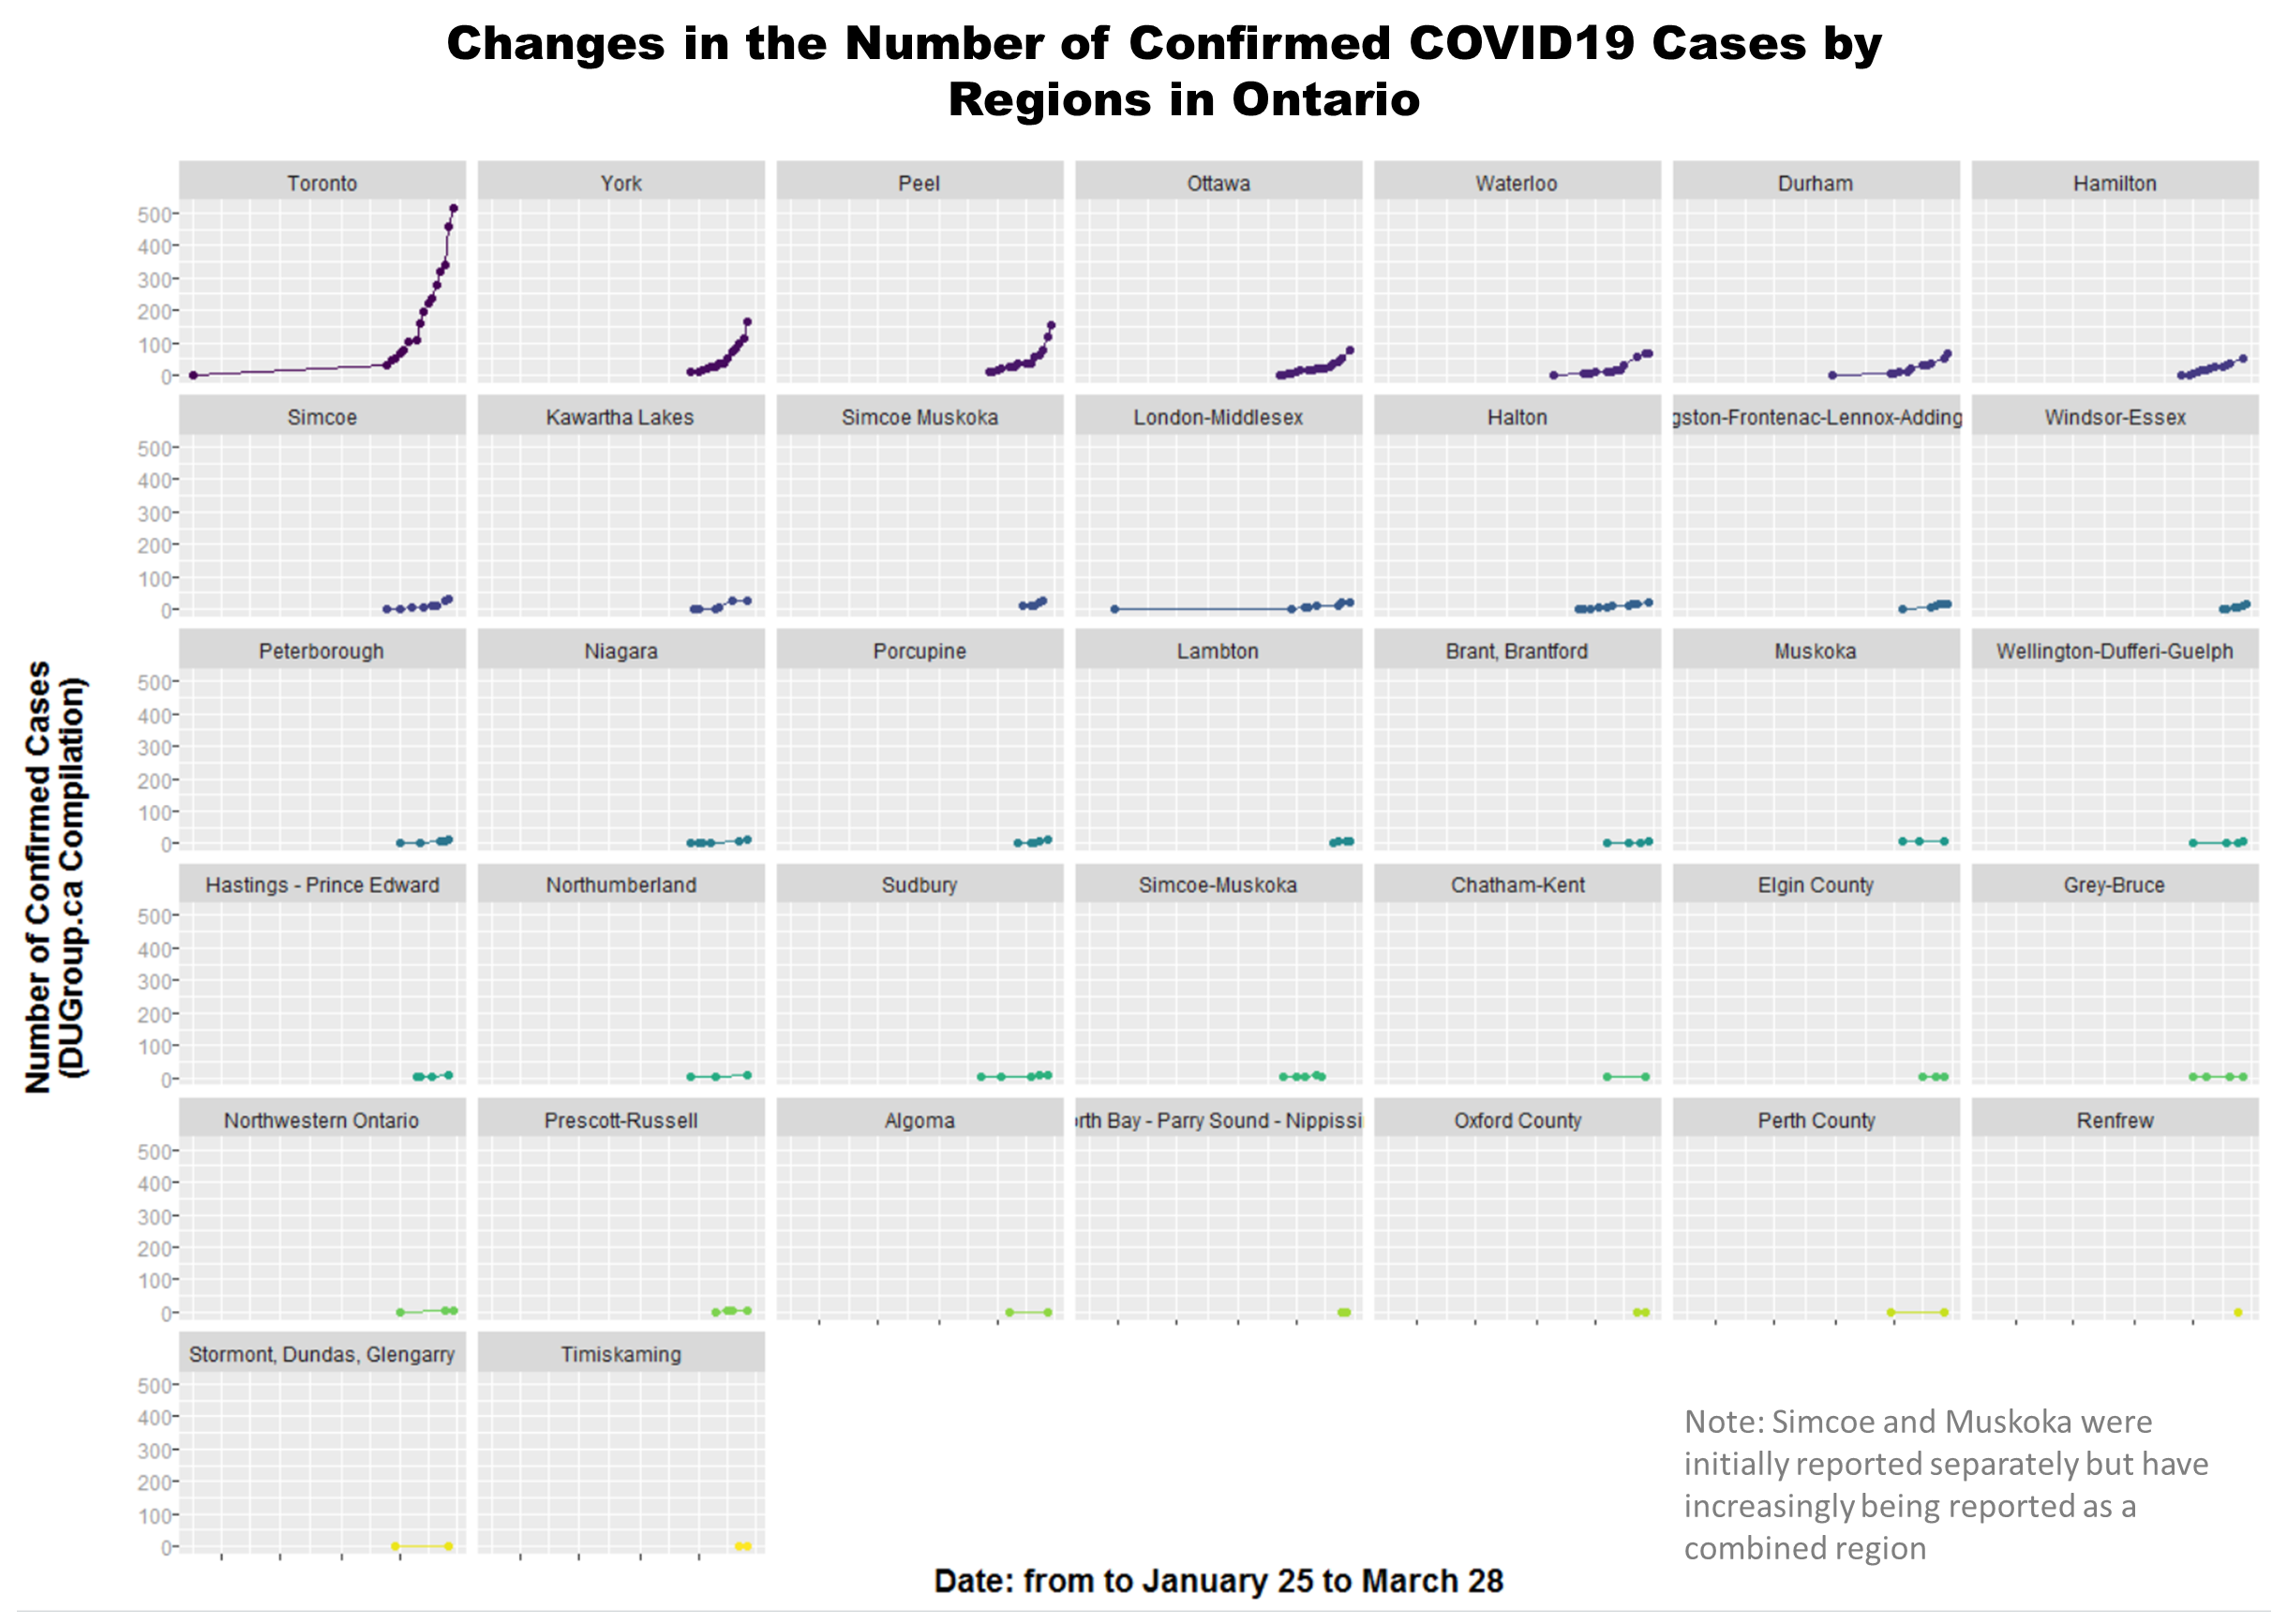
Data source: “Wikipedia” tab in the DUG Google Sheet
Tool: R
Data Collection Updates
- Records in the Wikipedia tab of the Google Sheet have been cross-referenced with local media reporting to fill in gaps on the formal Wikipedia site. Links to the media reports are included in the record as an additional reference and validation.
- CDUID codes have been added to the records in the Wikipedia tab of the Google Sheet to make it easier to produce maps in GIS platforms. These CDUID codes correspond to the 2016 Census Divisions managed by Statistics Canada. The 2016 Statistics Canada Census Division .shp file (polygons) is available here.
- Some of the data in the Wikipedia tab are reported for aggregated regions. An .shp file with corresponding merged regions is in development and will be posted shortly.
