
We are a group of researchers and analysts who are interested in data science and would like to use our expertise to contribute to the understanding of COVID-19 in our communities.
Looking for data…
One of the challenges we encountered trying to understand the spread of COVID-19 was finding a data source in a format that is easily accessible for analysis. When we were unable to locate such a file (and finding that the process to scrape data through R was too messy given the formats that the information has been released) we decided to take a manual approach. Using a few different sources, we have compiled data tables which are easily accessible in R (our favorite) and Python.
…Compiling our own
March 19, 2020
A COVID19 Googls Sheet for Ontario cases has been created, and is being maintained, with data from an Ontario government website and resources available on two Wikipedia pages. We will continue to update these tables until a more authoritative source of case records is made available, ideally by Public Health Ontario.
Resources: An invitation to explore and dive deeper
As we explore this data we will be sharing visualizations and insights on the Data User Group website. Our hope is that others will find our summaries useful. We extend an open invitation to others interested in data science to engage in additional analysis and use this data set for your own exploration. Resources include:
March 19, 2020
- A Github has also been created which will include the R code of our members as well as a .csv file that will be updated regularly. The Google Sheet will serve as our authoritative data source and the github will serve as our central repository for code. We invite any who are interested to contribute to the github.
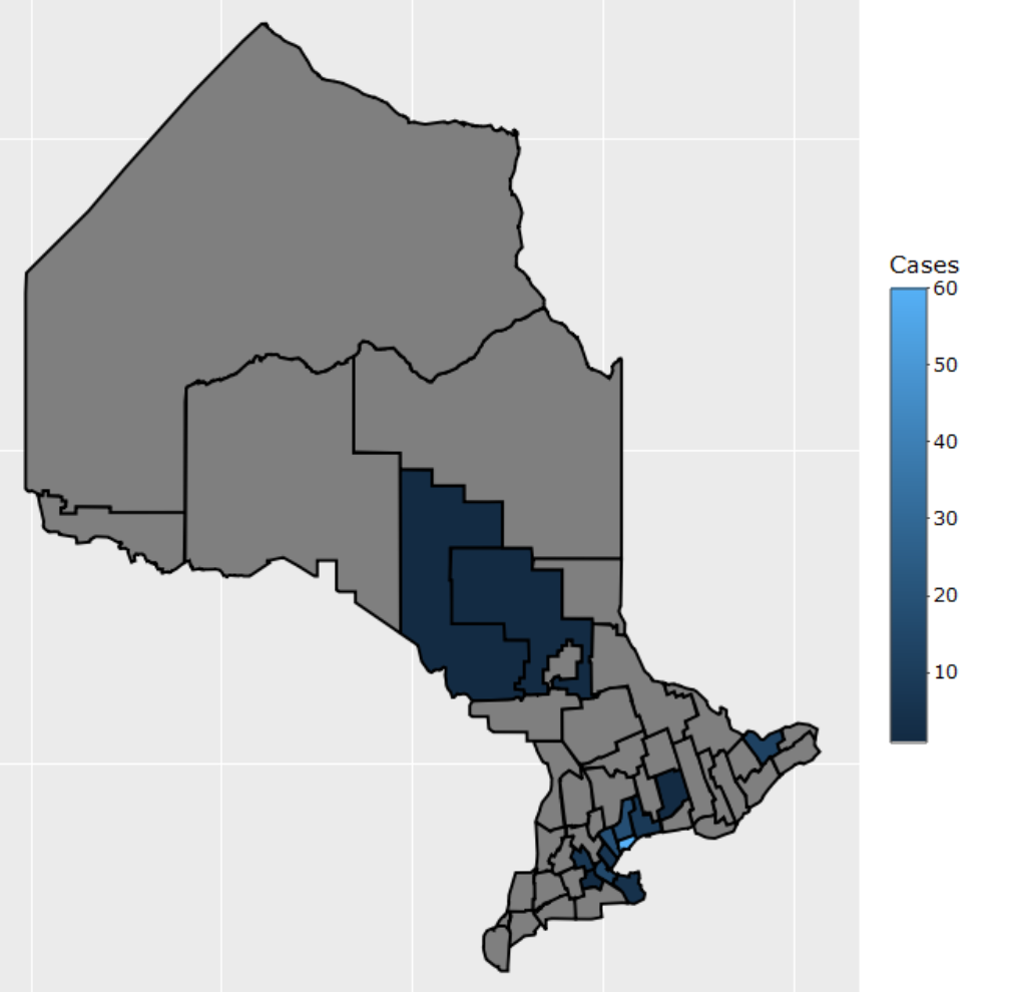
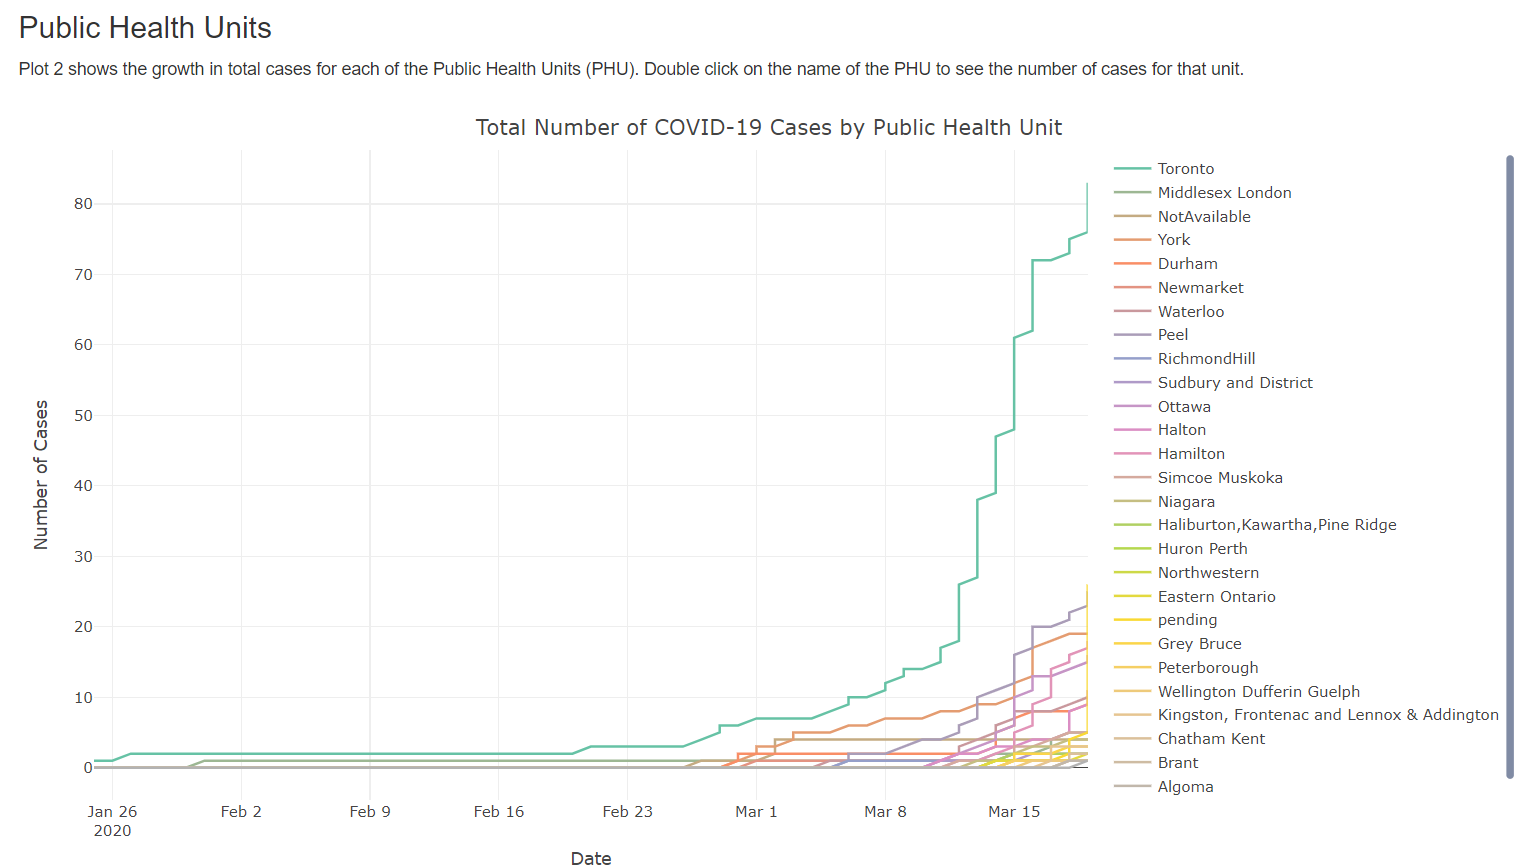
- A Shiny app of the github code has been created to provide interactive explorations of the COVID19 data by regional spread.
Data Background and Sources
The “Provincial Reporting” tab in the Google Sheet is a compilation of data from this Ontario government website. This webpage provides a table on new cases of COVID-19 diagnosed in the province. Following are notes about the data:
- Using the Wayback Machine, the earliest records that could be obtained began at case 32.
- The first 31 cases were then compiled by parsing the press releases available at the bottom of the page.
- Currently, case numbers 6, 16, 17 and 18 have not been found in the available press releases.
- Coding with respect to regional health unit appears to have changed over time. A new column has been added with recoded health unit labels for consistency.
- On March 18th the website stopped posting the hospitals the cases are related to.
- The data in the Google Sheet is updated daily from this website, around 10:30 am and 5:30 pm when the data is released.
The “Wikipedia” tab in the Google Sheet is a compilation of data from Wikipedia’s Thematic Google Map. Included in this map are interactive summaries by region which includes the number of cases, number of patients in local hospitals and buildings that have been impacted. Following are notes about the data that is published on this page:
- The data in the Google Sheet is updated daily from this website.
- Wikipedia also provides a table with time-series data for the spread of COVID-19 for each province. The data from this website is available in “Wikipedia National” tab in the Google Sheet and is updated less frequently than the other two tabs.
