Data Vis Workshop – Spring 2013
In the Spring of 2013 the members of the KNAER Data visualization project “The Use of Data Visualization Techniques to Share and Apply Toronto District School Board Research Findings” collaborated with the Association of Educational Researchers of Ontario (AERO) in a Special Interest Group (SIG) session titled “Seeing what is before us: The use of data visualization” at the Ted Rogers School of Management.
The work and resources developed by this KNAER Project and workshop will continue to be supported through DUG.
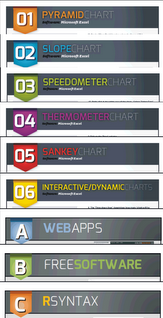
More information about the data visualization session can be found here along with the three resources that were shared during the SIG:
Data Vis with Excel Data Vis with R Data Vis with GIS

.
Mapping (GIS)
This section will feature tutorials, tips and tricks for mapping in R as well as with Quantum GIS. Mapping in R works through a variety of packages developed specifically for R. Quantum GIS is an open source desktop solution that functions in much the same was as ESRI’s ArcMap software.
Quantum GIS
You can download Quantum GIS (QGIS) here.
Tips
- Install “Table Manager” to make changes to the attributes table
- Use the Field Calculator to create new fields and transform values from string to text. this is useful when you only have to change 1 or 2 fields
- Use a .csvt file to define the data types for each field in a large CSV file. The .csvt file should only contain 1 row with “String” and “Integer” values used to represent each column in your .csv file. The .csvt file should be in the same directory as your csv and will be used by QGIS when you join the data to a shape layer.
- Spatial Selection: Click on Vector> Spatial Query
Select source features = layer with items to be selected
Reference features = layer used as the criteria for selection
Directions
GIS with R
ggmap is a package that works with ggplot2 to leverage google maps and overlay shape files.
