
Following are a few updates of visualizations that were presented last week:
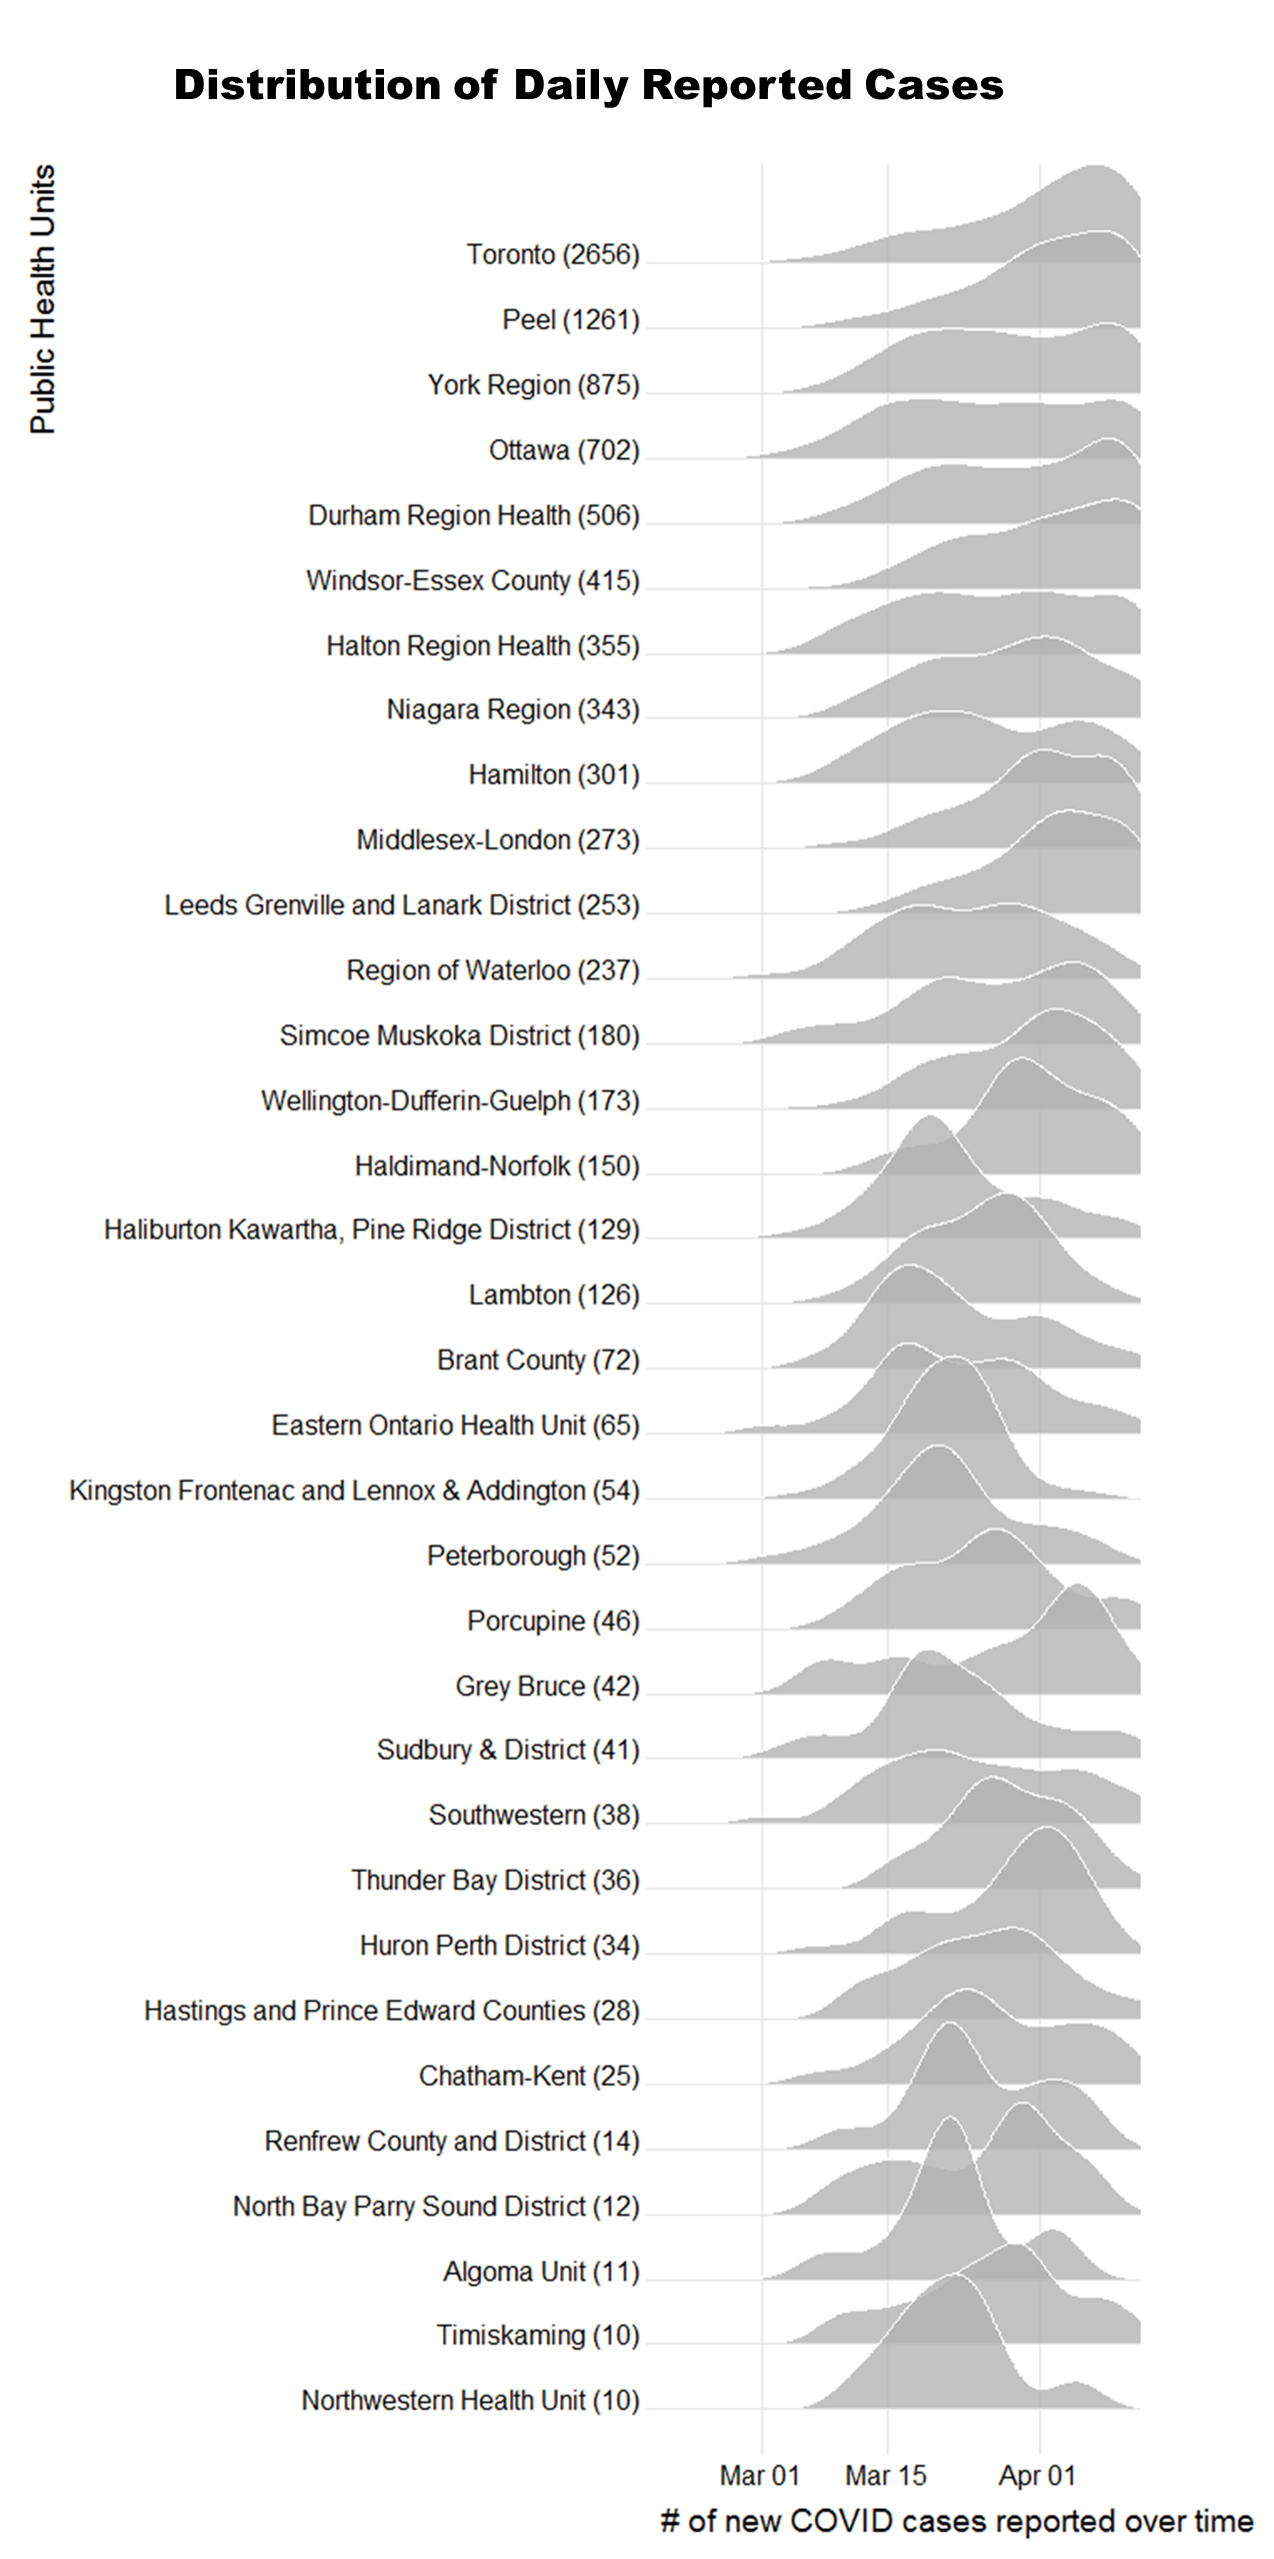
Exploring the shape of distributions of regionally reported cases:
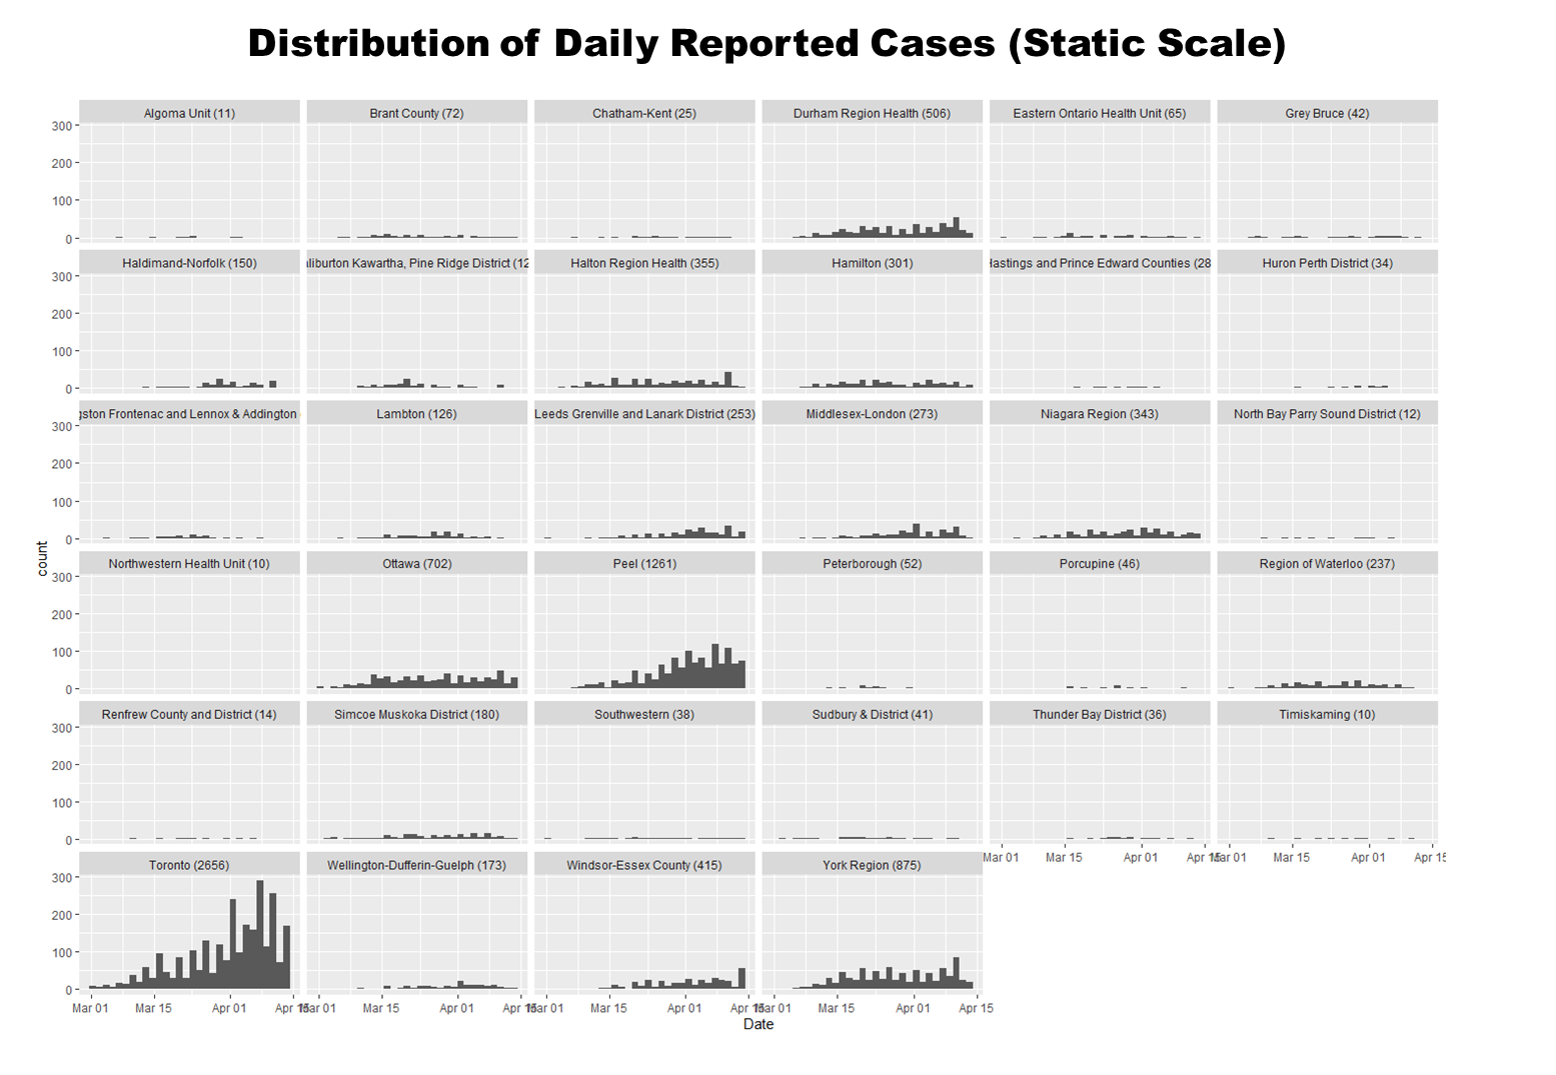
Daily reported cases by region over time using a static scale:
 Animation of cumulative daily reported cases by region:
